
Through practice, gently and gradually we can collect ourselves and learn how to be more fully with what we do. – Jack Kornfield
The CLAT Quantitative Techniques Previous Paper Analysis provides a comprehensive review of the patterns, difficulty levels, and types of questions that have asked in past CLAT examinations. Delving into the CLAT Quantitative Technique Previous Year Paper Analysis offers significant insights for you, enabling you to strategize effectively for upcoming exam.
The complexity of mathematical questions and the frequency of certain question types are rigorously examined in this analysis. The CLAT Quantitative Technique Last Year Paper Analysis is particularly beneficial for you if you are seeking to understand recent trends and changes in the examination format.
By focusing on the CLAT Quantitative Technique Previous Paper Analysis, you can determine areas requiring more attention, improve their time management skills, and bolster your overall preparation. This analysis will serve you as an invaluable tool, offering a detailed breakdown of the CLAT quantitative techniques section, thus helping you to optimize your study plan and approach the exam with confidence.

Upcoming CLAT Exams:
CLAT Quantitative Techniques- Pattern and Importance
The Pattern and Importance of CLAT Quantitative Techniques section in the CLAT exam cannot be overstated. This segment of the CLAT exam will test your mathematical and analytical prowess, making it a crucial part of their overall assessment.
Understanding the CLAT Quantitative Technique Previous Year Paper Analysis is key to grasping the pattern changes and question types frequently encountered. Moreover, the CLAT Quantitative Technique Last Year Paper Analysis provides insights into the most recent exam structure, highlighting the areas of focus and the level of difficulty.
Similarly, the CLAT Quantitative Technique Previous Paper Analysis offers a historical perspective, allowing you to track the progression and predict potential future trends in the exam. This thorough understanding of the pattern of the CLAT quantitative section and its importance is essential for any CLAT aspirant aiming for success in this highly competitive exam.
CLAT Quantitative Techniques Pattern
With the change in CLAT exam pattern, the Consortium of NLU has reduced the total number of questions from 150 to 120 and accordingly, the number of questions asked in the quantitative section has also been reduced.
Prior to 2020, in the CLAT quantitative section, a total of twenty (20) questions were asked, but after the year 2020, the number of questions has been reduced to fifteen (15). Moreover, after CLAT Quantitative Technique Previous Year Paper Analysis, we can also figure out that before 2020, one liner questions were asked. But since 2020, the quantitative technique section of the CLAT exam has tested your aptitude for data interpretation.
The Consortium of National Law Universities has modified the CLAT exam format for 2027 for admission to undergraduate programs beginning in the academic year 2027-2028.
| Subject | Number of Questions likely to be Asked | Approximate Weightage (in %) |
| Quantitative Techniques | 10-14 questions | 10% of the paper (approx.) |
The quantitative techniques section of CLAT exam will consist of 10-14 questions, i.e., approximately 10% of the paper.
Short sets of facts or propositions, or other written representations of numerical information, will be followed by a sequence of questions in the Quantitative Techniques for CLAT 2027. You will be expected to deduce information from passages or questions and apply mathematical procedures to that knowledge. This approach aligns with the trends observed in CLAT Quantitative Technique Previous Year Paper Analysis, where a similar pattern of questioning was noted.
The questions will ask you to:
- derive, deduce, and manipulate numerical data from such sections;
- apply a number of 10th standard computations, including basic algebra, ratios and proportions, mensuration, and statistical estimate.
This requirement is consistent with insights from the CLAT Quantitative Technique Last Year Paper Analysis.
The main goal of Quantitative Techniques for the CLAT 2027 is to examine your ability to solve issues and extract information from structured data using mathematical techniques. Rather than expecting advanced mathematical knowledge, it will be assessing basic arithmetic skills as well as data interpretation ability, a trend highlighted in the CLAT Quantitative Technique Previous Paper Analysis.
Importance of CLAT Quantitative Techniques
The quantitative technique section of the CLAT exam, accounting for approximately 10% of the paper, plays a pivotal role in the overall scoring. Though this percentage might appear minimal, its significance cannot be understated. For those with a strong aptitude in quantitative techniques, this section offers a unique opportunity to secure full marks.
The insights from the CLAT Quantitative Technique Last Year Paper Analysis show that, even though the section comprises a smaller portion of the exam, it has a significant impact on the overall score. Excelling in this section could be the deciding factor in securing a place at the top ranking National Law University (NLU) in the country.
Also Read: CLAT Quantitative Techniques Syllabus
CLAT Quantitative Technique Previous Year Paper Analysis – 2020
The CLAT Quantitative Technique Previous Year Paper Analysis – 2020 offers a detailed examination of the quantitative section from the 2020 CLAT exam. This analysis delves into question types and difficulty levels, as well as providing you with essential insights for aiming to excel in CLAT examination.
In 2020, a significant shift was observed in the CLAT exam’s format, particularly in the quantitative section. Data interpretation, a crucial skill in legal contexts. This change was evident in the presence of three graph and tabulation-based data interpretation passages. Each passage was accompanied by five questions, summing up to a total of 15 questions.
Topics Covered
In the 2020 CLAT Mathematics section, was identified in the CLAT Quantitative Technique section, the emphasis was on key mathematical topics –
- Percentage
- Ratio and Proportion
- Average
- Mensuration
Each of these areas played a crucial role in assessing the candidates’ numerical and analytical abilities. The CLAT Quantitative Technique Previous Year Paper Analysis further highlights that these topics were not only fundamental but also pivotal in determining the overall performance of the candidates in CLAT preparation.
Must Know for Every CLAT Aspirant:
| CLAT Eligibility Criteria | CLAT Exam Pattern |
| CLAT Age Limit | CLAT Marking Scheme |
| How to Prepare for CLAT? | CLAT Preparation Books |
Sample Passage
Direction: The following data presents the cases of Japanese Encephalitis in five states of India.
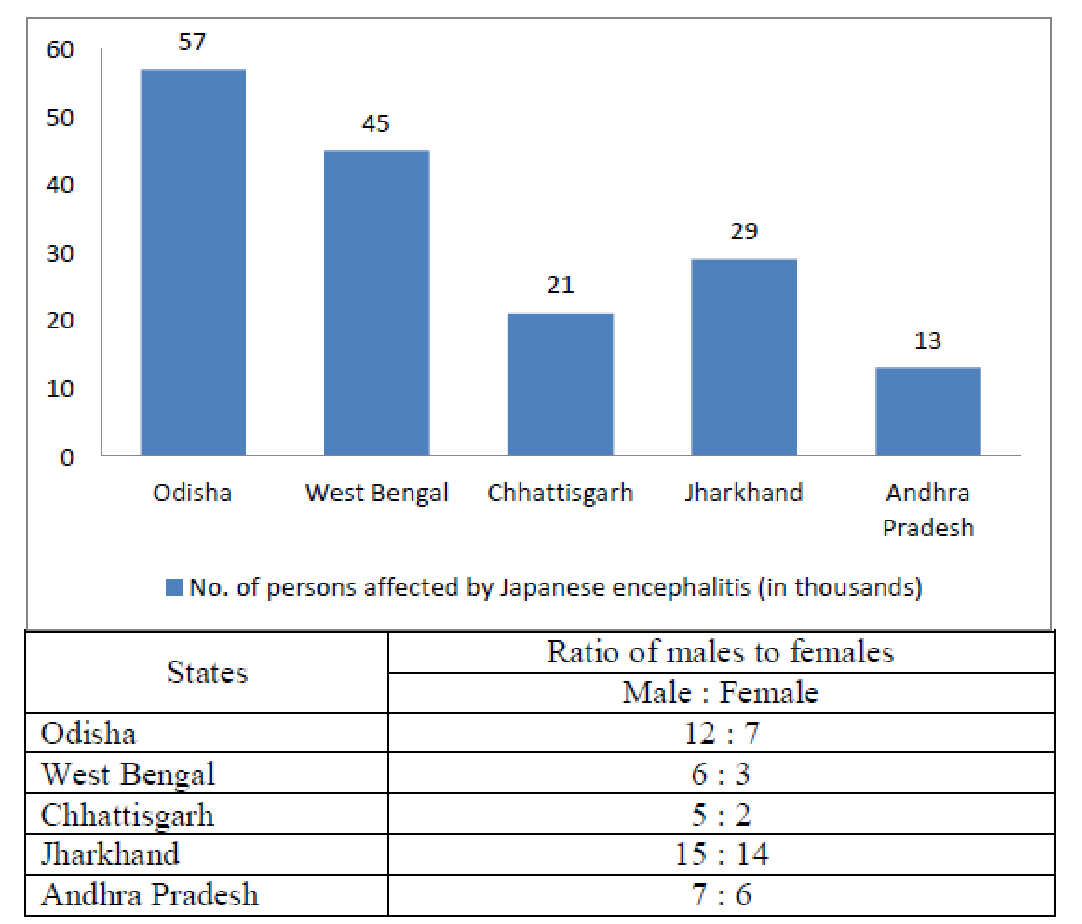
1. Number of females affected by Japanese encephalitis in West Bengal are what percentage (up to 1 decimal) more or less than that of females affected in Odisha?
(a) 28.6 % less
(b) 29.7 % more
(c) 26.8 % less
(d) 25.8 % more
2. What is the average number of males affected by Japanese encephalitis in all the five states?
(a) 9,000
(b) 13,500
(c) 18,400
(d) 20,600
3. If the total number of males affected by Japanese Encephalitis in other states are 87% more than the average number of males in Odisha, West Bengal, Chhattisgarh and Jharkhand, the total number of males affected in India is:
(a) 44,880
(b) 1,40,880
(c) 1,47,880
(d) 68,880
4. By what percentage is the average of males in Chhattisgarh, Jharkhand and Andhra Pradesh together more or less than the average of females in West Bengal, Jharkhand and Odisha together who are affected by Japanese encephalitis?
(a) 22
(b) 24
(c) 26
(d) 28
5. What is the percentage (up to 1 decimal) of females affected by ‘Japanese encephalitis‘ of the total affected population across five states?
(a) 25.4
(b) 36.7
(c) 24.5
(d) 37.6
Also Read: CLAT Quantitative Techniques Questions
CLAT Quantitative Technique Previous Year Paper Analysis – 2021
Topics Covered
The CLAT Quantitative Technique Previous Year Paper Analysis reveals that, similar to the 2020 pattern, the 2021 CLAT quantitative technique portion included three passage-based questions. Unlike the previous year’s graphics sections, they were text-based (caselet data interpretation) and extended up to 200 words each. Each passage was followed by five questions, contributing to a total of fifteen questions, consistent with the trend identified in the CLAT Quantitative Technique Previous Paper Analysis – 2020.
In the 2021 CLAT quantitative technique section, as identified in the CLAT Quantitative Technique Previous Year Paper Analysis, the emphasis was on key mathematical topics –
- Percentage
- Ratio and Proportion
- Average
- Profit and Loss
Each of these categories was critical in determining the candidates’ numerical and analytical abilities. The CLAT Quantitative Technique Previous Year Paper Analysis demonstrates that these themes were not only important but also pivotal in determining candidate’s overall performance.
Sample Passage
Two renowned international Software companies, namely Pollaris and Contigent, started their business in the year 2007 and both the companies were in competition with each other in profit making. Pollaris earned 30 per cent prof it in the year 2007 and 2008, and further increased it to 40 per cent in 2009. However, its profit percentage decreased to 20 per cent in the year 2010. On the other hand, Contigent opened with 40 per cent profit in 2007, but slowly decreased to 35 per cent in 2008 and 30 per cent in 2009. Interestingly, both the companies increased their profit percentage in the later year considerably. Pollaris increased its profit percentage to 35 per cent in 2011 and 50 per cent in 2012; simultaneously, Contigent increased its profit percentage to 45 per cent in 2010, 50 per cent in 2011 and reached 60 per cent in the year 2012. As there is a need to understand the income and expenditure for the better performance of both companies in the future, answer the following questions.
1. What is the increase in profit of Contigent Company in percentage from year 2011 to 2012?
(a) 10%
(b) 20%
(c) 15%
(d) Cannot be determined.
2. What percentage of the total profit making of Pollaris Company in 2011 and 2012 is the total profit making of Contigent Company in 2007 and 2008?
(a) 113.3%
(b) 95.3%
(c) 90.3%
(d) 133.3%
3. If the income of Contigent Company in 2008 was ₹ 200 crores, what was its profit in 2009?
(a) ₹ 21.5 Crore
(b) ₹ 46.15 Crore
(c) ₹ 153 Crore
(d) Cannot be determined.
4. What is the difference between the company with highest annual average profit percentage and that of the company with lowest annual average profit percentage?
(a) 5.17
(b) 8.33
(c) 9.17
(d) 4.33
5. What is the percentage increase in profit of Pollaris Company from year 2010 to 2011?
(a) 42.86
(b) 75
(c) 175
(d) Cannot be determined.
Law Colleges Information Related to CLAT:
| List of NLUs in India | CLAT Colleges in India |
| CLAT Colleges in Delhi | CLAT Colleges in Rajasthan |
| Top 5 NLUs in India | NLSIU Bangalore Seats |
CLAT Quantitative Technique Previous Year Paper Analysis – 2022
The 2022 CLAT quantitative technique section comprised three passage-based questions, as in the 2021 pattern. They were text-based and were up to 200 words. Each paragraph was followed by five questions, for a total of fifteen questions, keeping with the trend indicated in the CLAT Quantitative Technique Previous Paper Analysis – 2021.
Topics Covered
According to the CLAT Quantitative Technique Previous Year Paper Analysis, the emphasis of the 2022 CLAT quantitative technique section was on key mathematical topics –
- Percentage
- Ratio and Proportion
- Average
- Profit and Loss
Each of these topics played an important role in evaluating the candidates’ numerical and analytical abilities. The CLAT Quantitative Technique Previous Year Paper Analysis shows that these themes were not only relevant but also pivotal in determining the overall performance of the candidates.
Sample Passage
An Indian company, having its registered office at Gurugram, is engaged in manufacturing of consumer goods at Noida. The goods manufactured by the company are sold in Indian market and exported to Europe. Company produces five products namely ‘P’, ‘Q’, ‘R’, ‘S’ and ‘T’. Total production of the company for the financial year 2021-22 is 3,000 tonnes and the turnover of the company is ‘ Rs. 50 million. An analysis of the production and net revenue generation shows that production of product ‘P’ is 21% of the total production and 18% of the turnover is attributable to product ‘P’; production of ‘Q’ is 16% of the total production and 17% of the turnover is attributable to ‘Q’; ‘R’ accounts for 18% of the total production and 20% of the turnover; ‘S’ accounts for 20% of the total production and 25% of the turnover, and; ‘T’ accounts for 25% of total production and 20% of turnover.
1. What is the percentage of profit earned from sale of ‘R’, if the expenditure incurred on production of ‘R’ is ‘ 15,000/- per tonne?
(a) 20%
(b) 23.46%
(c) 26.55%
(d) 25%
2. Which product has the highest selling price per tonne?
(a) Q
(b) R
(c) S
(d) T
3. How much loss is incurred to company, if the expenditure on production of ‘T’ was ‘ 20,000 per tonne?
(a) 5 million
(b) 10 million
(c) 4 million
(d) 7 million
4. What percentage of turnover of ‘R’ has to turnover of ‘T’?
(a) 100%
(b) 75%
(c) 50%
(d) 60%
5. What is the average selling price per tonne of all products taken together?
(a) Rs. 17,488
(b) Rs. 17,667
(c) Rs. 18,667
(d) Rs. 16,667
CLAT Quantitative Technique Previous Year Paper Analysis – 2023
Following the CLAT Quantitative Technique Last Year Paper Analysis for 2023, a significant shift in passage lengths was observed. The analysis reveals that each passage was approximately 250 words, longer than in previous years. As per the CLAT Quantitative Technique Last Year Paper Analysis, this increase in word count made the section more challenging compared to prior years. The total number of questions remained at 15, with 5 questions per passage. This shift, as emphasized in the CLAT Quantitative Technique Last Year Paper Analysis, shows a shift toward more complex and detailed analysis, which effected the overall difficulty of the CLAT quantitative technique section.
Topics Covered
According to the CLAT Quantitative Technique Last Year Paper Analysis, the CLAT quantitative technique section of the 2023 CLAT focused on significant mathematical topics –
- Percentage
- Ratio and Proportion
- Average
- Profit and Loss
- Simple Interest
Each of these topics was crucial in assessing the candidates’ numerical and analytical abilities. According to the CLAT Quantitative Technique Previous Year Paper Analysis, these subjects were not only significant, but also crucial in determining the candidates’ total performance.
Sample Passage
The findings of Oxfam India’s latest ‘India Discrimination Report 2022’ indicate that there is a significant gap in the earnings between men and women in the case of regular and self-employment in urban areas. The lower wages for salaried women are due to 67 percent of discrimination and 33 percent due to lack of education and work experience. The average earning is Rs. 16,000 for men and merely Rs. 6,600 for women in urban areas in self-employment. The average earning of men is Rs. 19,800 as against Rs. 15,600 for women in regular/salaried employment in urban areas. Also, in urban areas the average earnings of men (Rs. 9,000) are significantly higher than women (Rs. 5,700) even in casual employment. Apart from women, historically oppressed communities along with religious minorities also continue to face discrimination in accessing jobs, livelihoods, and agricultural credit. The mean income for Scheduled Castes or Scheduled Tribes (“SC/ST”) persons in urban areas who are in regular employment is Rs. 15,300 as against Rs. 20,300 for persons belonging to the non-SC/ST category. The average earning of self-employed workers is Rs. 15,900 for non-SC/STs and Rs. 10,500 for SC/STs. The average monthly earning for the SC/ST workers in casual work is Rs. 8,000 below the corresponding figure of Rs. 8,600 for the non-SC/ST.
[Data Source: Oxfam India]
[Note: Values have been approximated to the nearest hundred]
1. Choose the correct option:
(a) Women’s average earnings in urban areas in casual work is 30% lower than that of men
(b) Men’s average earning in urban areas in self-employment is nearly 2.5 times that of earnings of women
(c) In casual work, women earn more in rural areas than in urban areas
(d) The difference in earnings of men and women in regular/salaried employment in urban areas is Rs. 3,500
2. Of the regular employed in urban areas, the earnings of a non-SC/ST worker is what percent more than a SC/ST worker?
(a) Between 20% and 25%
(b) Less than 15%
(c) Between 30% and 35%
(d) More than 35%
3. Of those in casual employment, if a man’s average earnings was deposited at a rate of 16% simple interest for 20 years, in how many years at the same rate of simple interest a SC/ST worker must deposit their average earnings to earn the same amount as a man in 20 years?
(a) 24 years
(b) 22.5 years
(c) 21 years
(d) 23.2 years
4. The findings also indicate discrimination as a driving factor behind low Women’s Labour Force Participation Rate (LFPR) in the country. As per the Union Ministry of Statistics & Programme Implementation (MoSPI), LFPR for women in India was only 25.1 percent in 2020-21 for urban and rural women. This is considerably lower than South Africa where the LFPR for women is 46 percent in 2021 as per the latest World Bank estimates. The LFPR for women in India has rapidly declined from 42.7 percent in 2004-05 to mere 25.1 percent in 2020-2021 showing the withdrawal of women from the workforce despite rapid economic growth during the same period. In 2019-20, 60 percent of all males aged 15 years and more have regular salaried and self-employed jobs while 19 percent of all similarly aged females get regular and self-employment. Use the additional data in the passage above to answer this and the next question.
If the number of women in India in 2020-2021 is 670 million which is 24% more than in 2004-2005, what is the difference in the number of women in LFPR 2004-05 and 2021?
(a) Less than 5 crores
(b) Between 6 and 8 crores
(c) Between 10 and 12 crores
(d) More than 15 crores
5. In 2019-20, if the number of males aged 15 years and more is 76% of the total male population and the number of females aged 15 years and more is 72% of the total female population and the total male population is 1.05 times the total female population, what is the ratio of females to males aged 15 years and more that have regular salaried and self-employed jobs?
(a) 2 : 7
(b) 3 : 10
(c) 5 : 9
(d) 1 : 3
Key resources to explore after your CLAT exam
| CLAT 2026 Result | CLAT 2026 Answer Key |
| CLAT 2026 Counselling | CLAT 2026 Admit Card |
| CLAT 2026 Marks vs Rank | CLAT 2026 Rank Predictor |
| CLAT 2026 Question Paper | CLAT 2026 Toppers |
| CLAT College Predictor |
Important Quantitative Techniques Topics for 2027
As we delve into the CLAT Quantitative Technique Previous Year Paper Analysis, we are keen to share essential insights for the upcoming 2027 exam. The analysis, including the CLAT Quantitative Technique Last Year Paper Analysis, has been instrumental in identifying the most important quantitative technique topics. This knowledge, stemming from the CLAT Quantitative Technique Previous Paper Analysis, is vital for you to excel in the 2027 CLAT examination. The important topics for quantitative techniques for 2027 are –
- Percentage
- Ratio
- Proportion
- Profit & Loss
- Partnership
- Ages Average
- Simple Interest and Compound Interest
- Time and Work
- Time, Speed and Distance
- Boat and Stream
- Mensuration
- Probability
- Crypt Arithmetic
- Venn Diagram
Resources for CLAT PG Preparation:
Tips for CLAT Quantitative Techniques Questions
You can ace the CLAT quantitative techniques with consistent practice. The tips listed below can be utilized for answering the CLAT quantitative techniques question: –
- Improve at reading passages and analyzing the information provided so as to practice passage-based D.I.
- Make sure that you practise them on topic based in order to easily understand the pattern of questions and can clear your concept easily.
- To make your fundamentals clear, you should practise at least four (4) D.I on a daily basis.
- Strengthen your calculations. You ought to be familiar with the tables, cubes, and squares at your disposal.
- You can improve your speed by practicing answering questions in the allotted time.
- Practice as many of the previous year’s question papers and mock exams as possible to improve your speed and accuracy.
- Finally, do not be afraid of quantitative technique questions. When you begin to practice on a daily basis, your chances of making mistakes reduce, and you will soon be able to answer questions with ease.
Conclusion
Thorough exploration of the CLAT Quantitative Technique Previous Year Paper Analysis has provided us with invaluable insights into the patterns and complexities of the Quantitative Techniques section. The CLAT Quantitative Technique Last Year Paper Analysis particularly highlighted how the questions have evolved, guiding our focus on key areas for future exams. This comprehensive understanding, drawn from the CLAT Quantitative Technique Previous Paper Analysis, has equipped you with the necessary tools and knowledge to approach the CLAT Quantitative Techniques section with confidence and precision.
Free CLAT Study Material for You:
| CLAT Previous Year Papers PDF | CLAT Sample Papers |
| CLAT Syllabus PDF | Free CLAT Coaching |
| CLAT Current Affairs | CLAT Topper Interviews |
| CLAT Videos | CLAT Mock Tests |
Free Previous Year Papers of CLAT
| CLAT 2025 Question Paper | CLAT 2024 Question Paper |
| CLAT 2023 Question Paper | CLAT 2021 Question Paper |
| CLAT 2020 Question Paper | View All (Past 17 Years) |
Important CLAT Questions for Practice:
| CLAT Legal Reasoning Questions | CLAT Logical Reasoning Questions |
| CLAT English Questions | CLAT GK Questions |